North American Electric Reliability Council Region Margin Charts
|
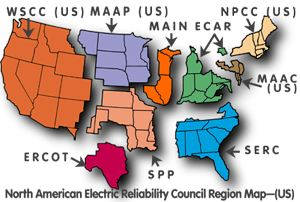
NERC Margin Chart for entire US
ECAR Margin Chart
NPCC (US) Margin Chart
ERCOT Margin Chart
SERC Margin Chart
MAAC (US) Margin Chart
SPP Margin Chart
WSCC (US) Margin Chart
MAIN Margin Chart
As these charts show, the margin between peak demand for electricity and
the generating capacity to meet that demand is shrinking to nothing in most
of the country. This is a crisis.
Without capacity we get blackouts. At best, brown-outs.
Capacity shown is for summer. Peak demand is non-coincident for all the utilities in the region.
Please Note: In September 1996 most of Florida became a separate NERC region, the Florida Reliability Coordinating Council (FRCC). For purposes of historical trend analysis we have included FRCC in SERC.
MAPP (US) Margin Chart
WHY NOT STOP USING COAL? | HOME | HELP | WEBMASTER | SITE MAP